Customizing the solver
The previous example Fitting experimental data is chosen again.
This time, noise and outliers are added to the data
import impedancefitter

rcParams["figure.figsize"] = [15, 10]


# parameters
frequencies = numpy.logspace(0, 8, num=50)
Rct = 100.0
Rs = 20.0
Aw = 300.0
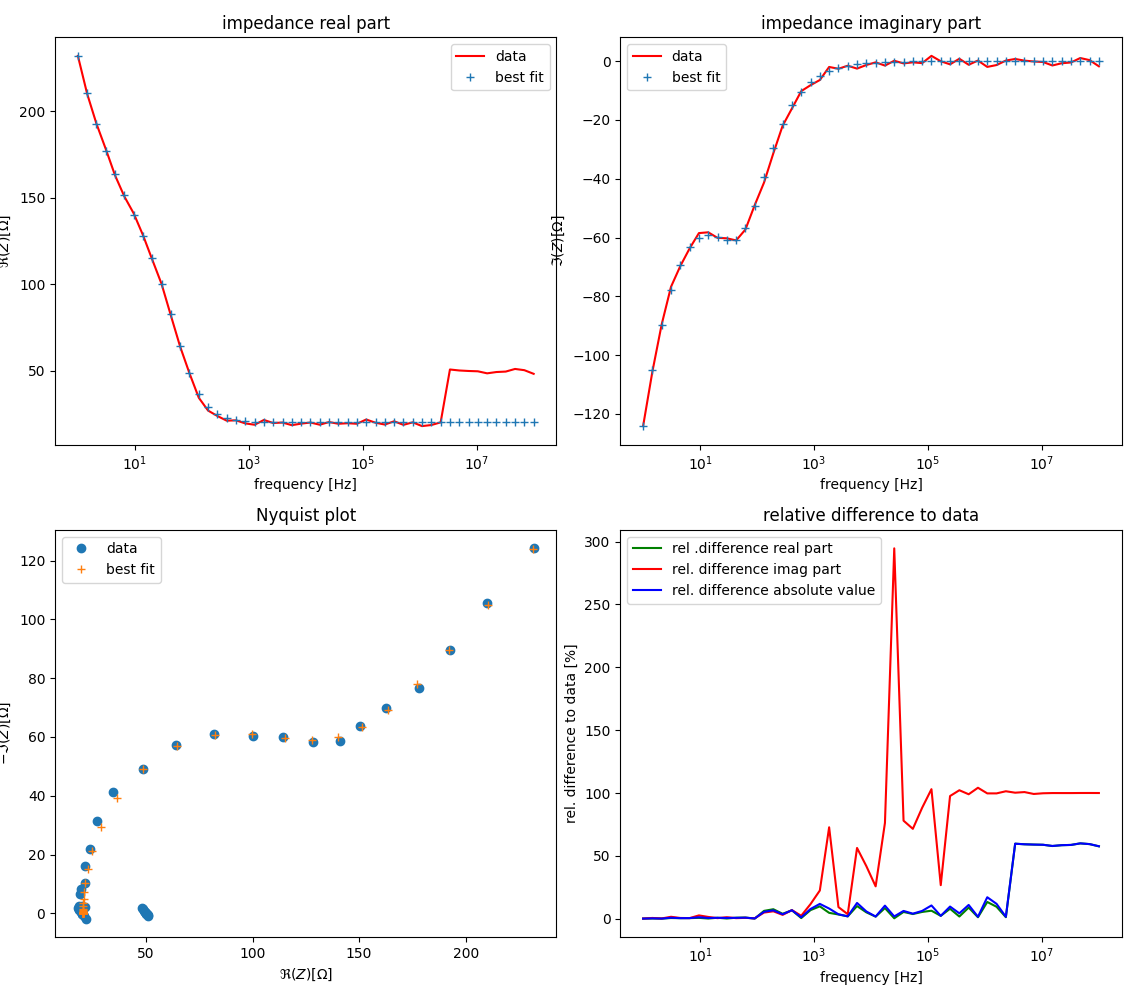
When running the fit with the standard least-squares solver, we obtain
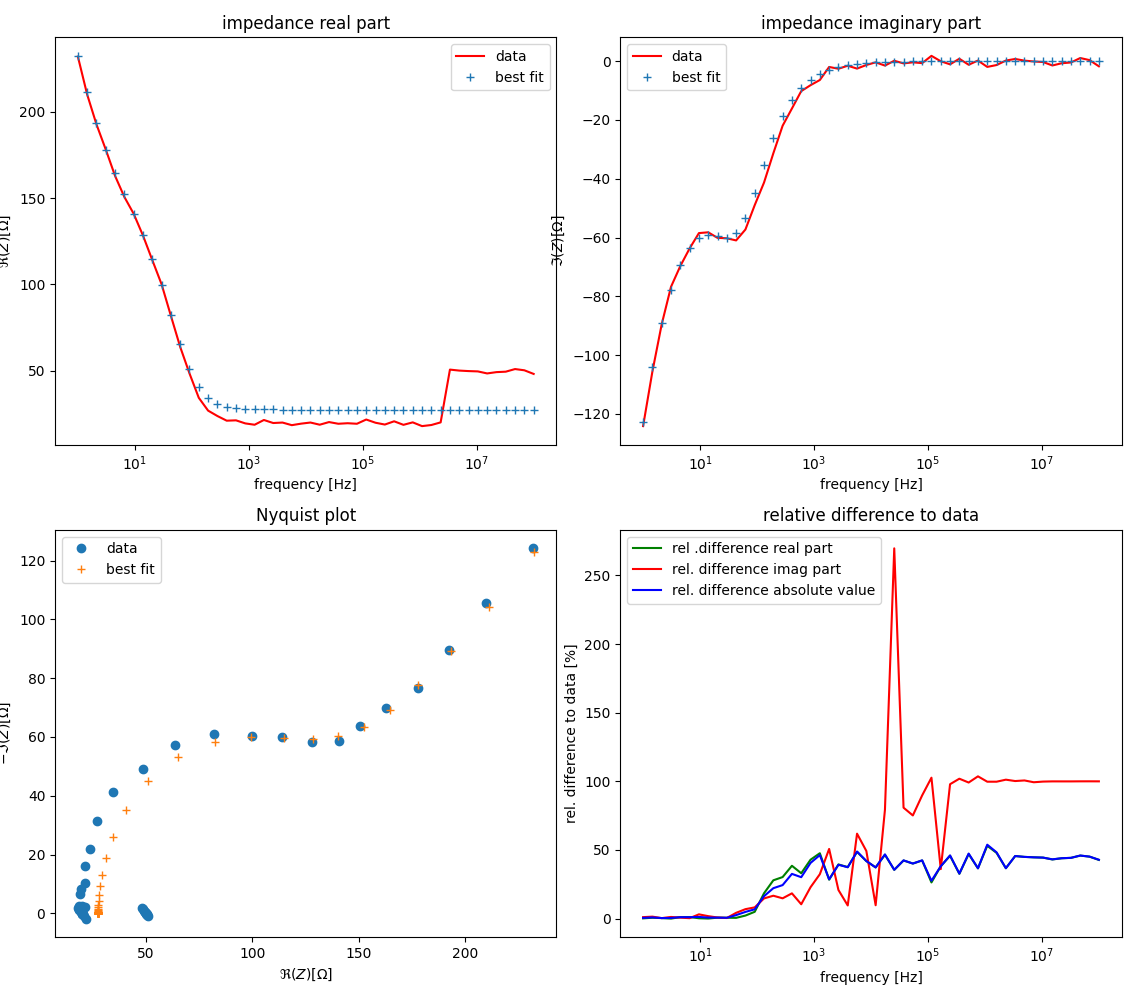
Instead, we can customize the solver:
df = pandas.DataFrame(data=data)
df.to_csv("test.csv", index=False)

# initialise fitter with verbose output
fitter = impedancefitter.Fitter("CSV", LogLevel="DEBUG")
and obtain